
How StrategyNet works: separating signal from noise
StrategyNet organizes quantitative investment research from the definition of a signal through current measurement, historical testing, and portfolio allocation. It connects each score and result to the inputs and calculation that produced it, so researchers can trace the evidence behind a portfolio decision.
This walkthrough explains the four stages and the records they retain. Changes to a signal's universe, data fields, observation cutoff, or normalization create a new version, with historical tests attached to that version. The same record then connects validated factors to portfolio risk controls and trading costs.
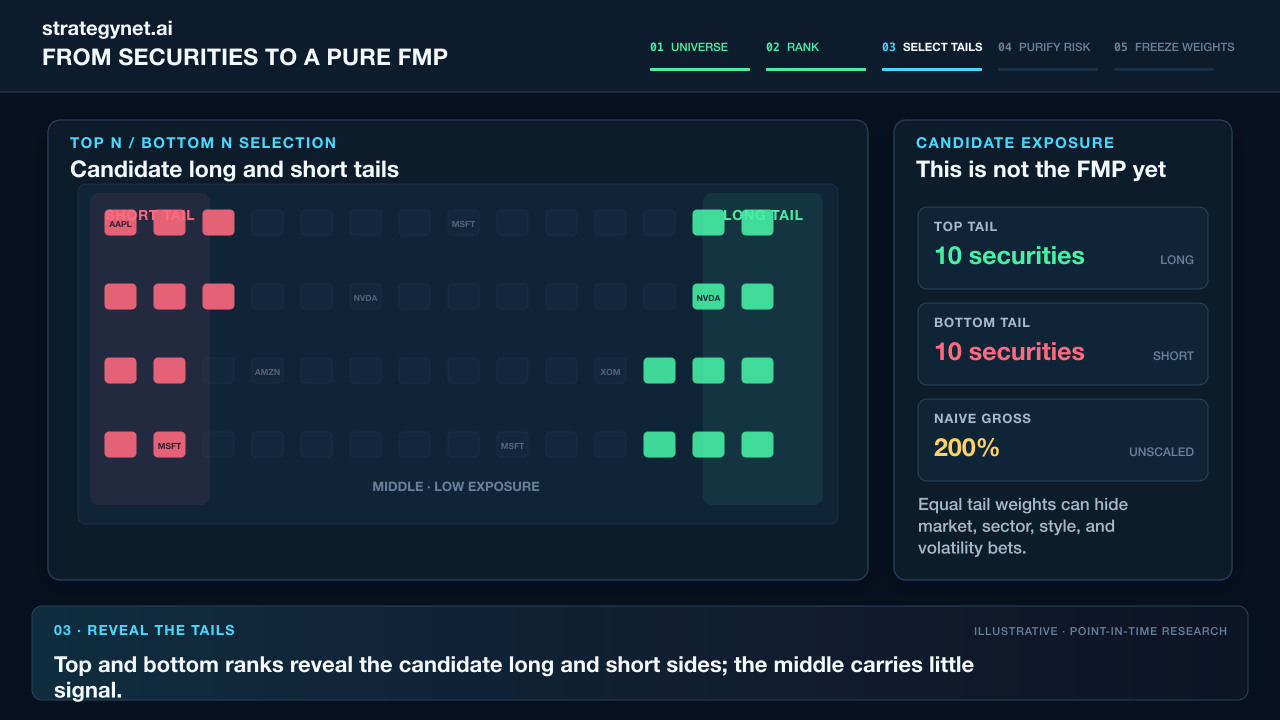 From signals to a pure FMPDefine the signal from dated inputs, then construct a portfolio that isolates its intended exposure.
 Realtime Factor ProjectionsApply the frozen definition to currently available evidence and report coverage-aware security ranks.
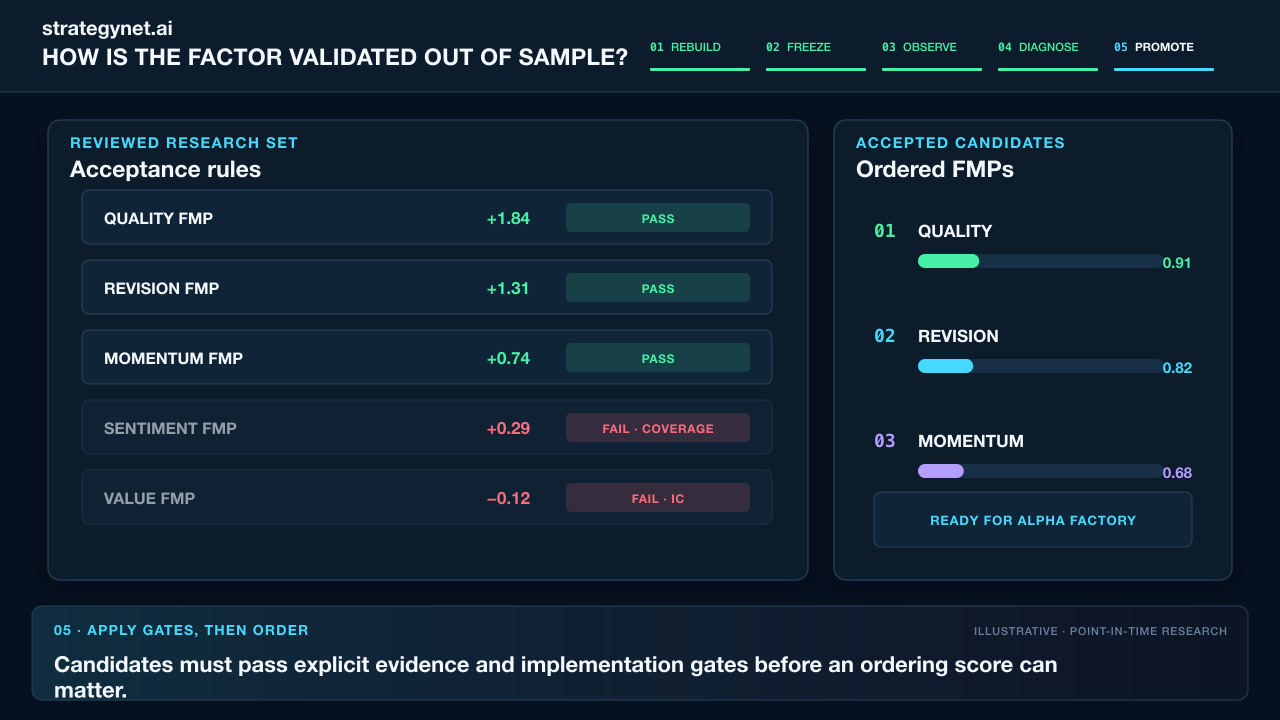 Walk-forward FMP validationRebuild each historical decision using only information available then, and measure what survived out of sample.
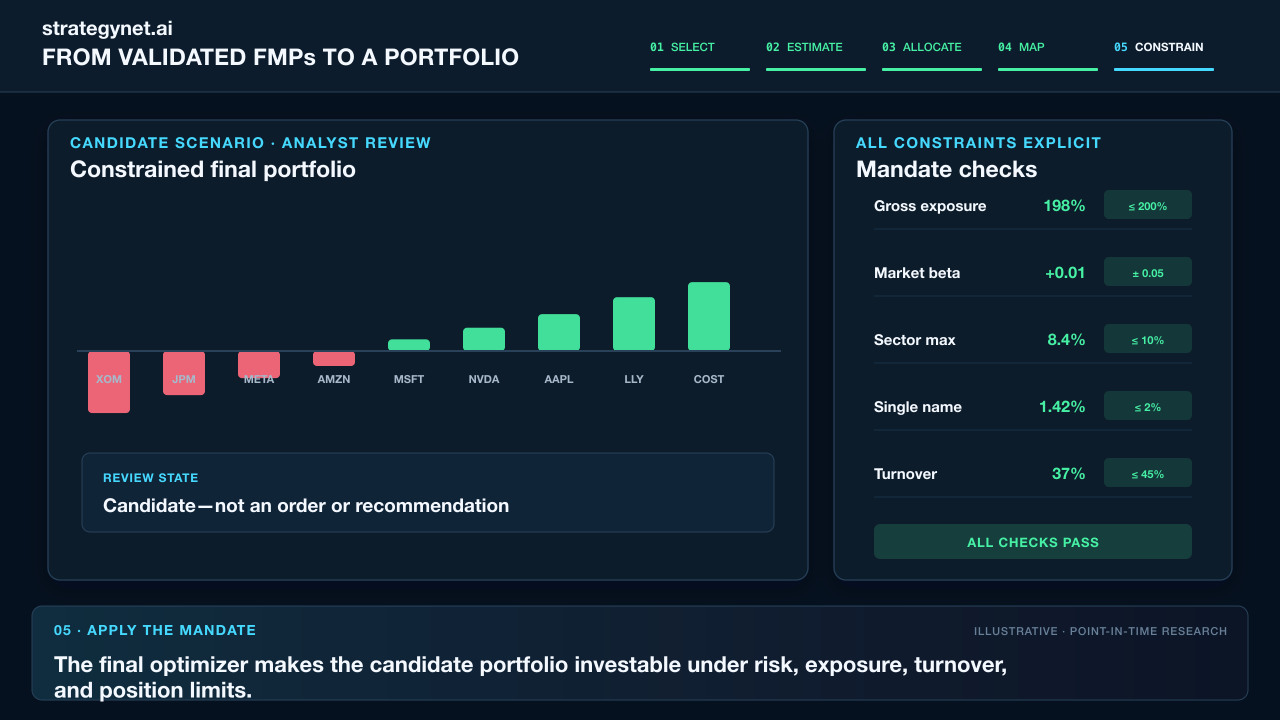 From selected FMPs to a final portfolioCombine distinct validated factors and apply portfolio risk, exposure, turnover, and position constraints.
1. Define exactly what is being measured
A research idea begins as a hypothesis expressed in ordinary language: perhaps firms with improving earnings revisions will outperform peers, or crowded positions will be vulnerable when liquidity deteriorates. Before the idea can be tested, it has to become a calculation that another researcher could repeat. The definition fixes the source fields, transformations, eligible universe, observation time, direction, and forecast horizon, while each input retains the timestamp at which it became available.
Those availability times are part of the economic meaning of the signal rather than administrative metadata. A test dated before an economic release was revised must use the first published value, and a historical equity cross-section must use the index membership known on that date rather than the constituents that survived until today. Applying these rules prevents later knowledge from improving an earlier decision and makes the resulting history a sequence of calculations that could actually have been made.
The objects in that sequence have deliberately narrow roles. A feature records one dated measurement about a security; a signal combines one or more features into a forecast that can be compared across the eligible universe; and a factor-mimicking portfolio (FMP) supplies the security weights that express the signal while controlling exposures such as market beta, sector, or size. If the inputs and transformations cannot be reconstructed at the original information date, there is no defensible basis for attributing later performance to the proposed signal, so the research does not advance to the next stage.
2. Measure the current signal
Once the definition is fixed, the same calculation can be applied to the most recent eligible inputs. StrategyNet reports the resulting security scores and cross-sectional ranks together with coverage, freshness, and the observation time, allowing a reader to see not only where a security ranks but how much current information supports that rank. A score based on nearly complete, recent inputs should not be presented as equivalent to the same number derived from a sparse or stale cross-section.
This current record describes the state of the factor; it does not establish that the factor forecasts returns. Consider a security that moves to the top of a crowding signal today. The observation becomes evidence only after the signal's declared horizon has elapsed and the subsequent return can be compared with the returns of the other securities that were eligible at the same time. Until that outcome exists, even an extreme rank is simply a measurement made under the registered definition.
3. Test whether the relationship persists
Historical testing repeats that process across many prior dates. At each decision point, walk-forward validation rebuilds the signal and its FMP from the information available then, applies the construction and trading rules that would have governed the position, and waits for the later outcome before scoring it. The exercise therefore produces a chain of simulated decisions rather than a single fit to the full history, with the promotion criteria fixed before the unseen period is evaluated.
No one statistic is sufficient because different diagnostics expose different ways a relationship can fail. Cross-sectional ranking measures whether the ordering was informative, while the FMP return shows how much of that ordering survived neutralization and position limits; turnover and estimated costs indicate whether it could have been implemented, and coverage, concentration, tail behavior, and stability reveal whether the result depended on a narrow or fragile part of the sample. A factor that appears strong on average may still be unusable if its signal decays before the next feasible trade or if nearly all of its return came from a handful of securities.
The evaluation record also retains rejected signals, including those that weaken outside their fitting window, duplicate an existing exposure, or lose their advantage after costs. Recording the hypothesis and the reason for rejection helps researchers assess later variants against the accumulated evidence. Data Mining in Nonstationary Markets describes the trial ledger, forward splits, multiplicity controls, and decay diagnostics used to separate that evidence from the results of repeated search.
4. Ask whether the evidence improves the portfolio
Passing the historical test makes a factor eligible for allocation, but it does not entitle the factor—or a highly ranked security within it—to a position. The allocator evaluates the factor alongside every other validated candidate using their expected returns, covariance, and behavior during historical joint losses. Two factors with attractive standalone histories may, for example, both amount to the same sector bet; assigning a large weight to each would concentrate risk without adding much independent information.
Portfolio construction resolves those interactions under the mandate's constraints. Limits on common-factor exposure, liquidity, turnover, concentration, and individual position size can reduce an otherwise attractive allocation, while an existing holding or an offsetting signal may remove the need for a new trade altogether. In that setting, a high current score and a zero portfolio weight are not contradictory: the first describes the security's place in one cross-section, whereas the second reflects the marginal value of expressing that view inside the whole portfolio.
The holdings that remain are therefore the result of two distinct tests. The research process asks whether the measurement generated repeatable evidence, and the allocation process asks whether adding that evidence improves the portfolio after its interactions and implementation costs are taken into account.
The evidence retained at each stage
Each record supports one downstream decision
| Record | Evidence retained | Decision enabled |
|---|---|---|
| Factor definition | Inputs, timing, universe, transformations, horizon, version | Repeat the same calculation |
| Current observation | Dated scores, ranks, coverage, freshness | Describe current factor state |
| Historical evaluation | Unseen outcomes, stability, dependence, turnover, costs | Retain or reject the factor |
| Factor portfolio | Risk-controlled weights and realized return history | Compare validated exposures |
| Portfolio result | Objective, constraints, allocations, holdings, diagnostics | Implement this mandate's decision |
Taken together, these records make it possible to follow a holding back through the allocation that selected it, the FMP that supplied its weight, the out-of-sample history that justified considering the factor, and the dated inputs that produced the original score. From Factor Observations to Portfolio Holdings develops that chain mathematically and shows how several factor portfolios combine into final security positions.
This walkthrough is for research and educational purposes. It illustrates how strategynet.ai organizes signal evidence into factors and scenarios. It provides no recommendation, investment advice, or instruction to trade any security.
Back to Insights