
How to calculate information coefficient
The information coefficient measures the cross-sectional correlation between signal values and subsequent security returns. A reproducible calculation pairs each score with the return over its specified forecast horizon, using only scores that were available before that return began.
This article works through the alignment, ranking, and correlation steps in a small numerical example and Python calculation. It explains the timing, universe, currency, and missing-value conventions needed to compare IC results consistently.
Rank IC definition
Let \(U_t\) be the eligible securities at observation time \(t\), \(f_{i,t}\) the score for security \(i\), and \(R^{(b)}_{i,t\rightarrow t+h}\) its subsequent return over horizon \(h\) in base currency \(b\). Rank IC is
\[\operatorname{IC}^{\mathrm{rank}}_t = \operatorname{corr}_{i\in U_t} \left( \operatorname{rank}(f_{i,t}), \operatorname{rank}(R^{(b)}_{i,t\rightarrow t+h}) \right).\]
This is one cross-sectional observation. Repeating the calculation at later dates produces an IC time series.
Worked example
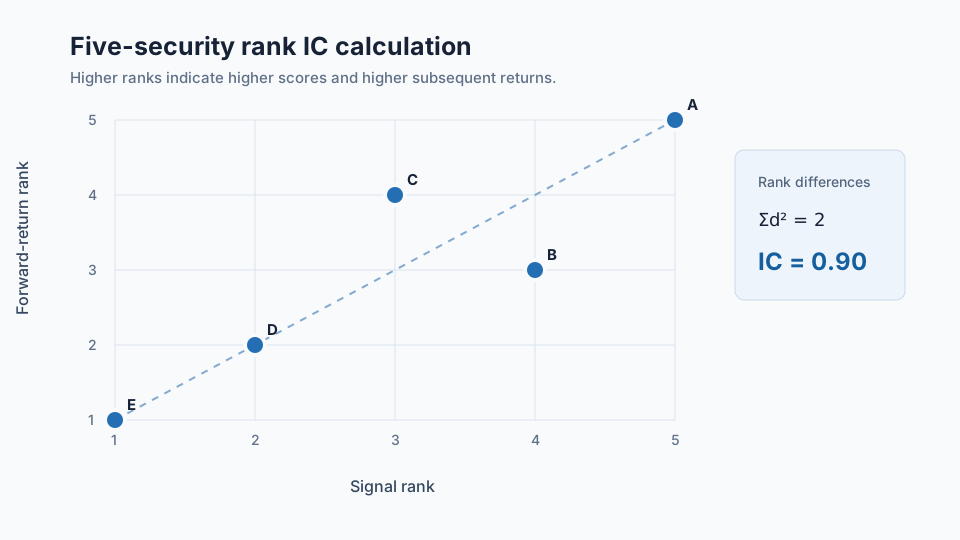
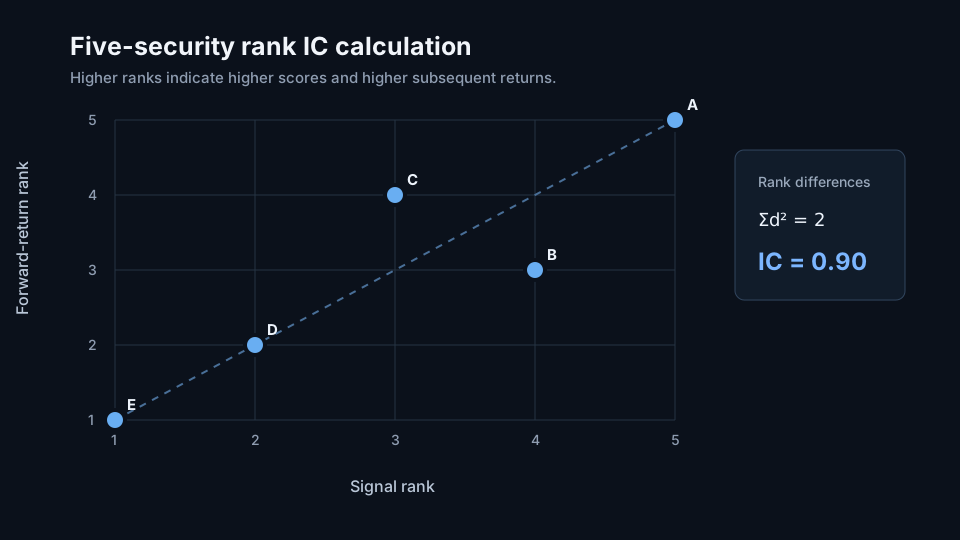
Suppose five securities have the following scores at today's close and the following returns over the next trading day. Rank 5 is the highest value.
Five-security rank IC calculation
| Security | Score | Score rank | Forward return | Return rank | Rank difference |
|---|---|---|---|---|---|
| A | 0.90 | 5 | +3.0% | 5 | 0 |
| B | 0.70 | 4 | −1.0% | 3 | 1 |
| C | 0.20 | 3 | +2.0% | 4 | −1 |
| D | −0.10 | 2 | −2.0% | 2 | 0 |
| E | −0.60 | 1 | −4.0% | 1 | 0 |
Only B and C are out of order. With no tied ranks, Spearman correlation can be calculated from the rank differences \(d_i\):
\[\rho = 1-\frac{6\sum_{i=1}^{n}d_i^2}{n(n^2-1)} = 1-\frac{6(2)}{5(25-1)} = 0.90.\]
The shortcut above assumes there are no ties. Production calculations should use a rank-correlation implementation with a documented tie convention.
Python calculation
The following code reproduces the worked example. The rows are already aligned by security, and incomplete pairs are removed before the correlation is calculated.
import pandas as pd

observations = pd.DataFrame(
    {
        "score": [0.90, 0.70, 0.20, -0.10, -0.60],
        "forward_return": [0.03, -0.01, 0.02, -0.02, -0.04],
    },
    index=["A", "B", "C", "D", "E"],
)

valid = observations.dropna(subset=["score", "forward_return"])
rank_ic = valid["score"].corr(valid["forward_return"], method="spearman")

print(f"Rank IC: {rank_ic:.2f}")  # Rank IC: 0.90
pandas.Series.corr aligns Series by index and excludes missing pairs. Keeping
the alignment and missing-value decision explicit makes the test easier to
audit.
Interpreting the result
A positive IC means higher scores tended to precede higher returns in the tested cross-section. An IC near zero means the ordering carried little monotonic information on that date. A negative IC means higher scores tended to precede lower returns.
The value \(0.90\) is intentionally easy to verify and comes from only five securities. It is not evidence that a signal is reliable. Research decisions require an IC history across many observation dates, with coverage and market conditions recorded for each date.
Common calculation errors
Using the wrong return period
The return must begin after the score was observable. A same-period return can introduce look-ahead bias or test a relationship the signal could not have traded.
Pooling dates before calculating correlation
Cross-sectional IC is calculated separately at each observation date. Pooling securities and dates into one correlation mixes cross-sectional ranking with time-series variation.
Reconstructing history with today's universe
Eligibility must be determined at each historical observation time. Using only current constituents introduces survivorship bias.
Allowing silent index mismatches
Scores and returns need a common security identifier and observation date. Inspect the joined data and the number of valid pairs before calculating IC.
Leaving ties and missing values unspecified
State the ranking method used for ties and whether incomplete pairs are omitted. The same rules must be applied across dates and candidate signals.
Treating one IC as a significance test
One cross-section measures ordering on one date. Statistical inference normally uses the IC time series and must account for serial dependence, changing coverage, and overlapping forecast horizons.
From one date to an IC history
In a factor test, the calculation is repeated for each observation date:
- Select the point-in-time eligible universe.
- Load scores available by the stated cutoff.
- Form forward returns over the chosen horizon.
- Align the two fields by security and remove invalid pairs.
- Enforce a minimum cross-sectional sample size.
- Calculate Pearson IC, rank IC, or both.
- Store the IC, security count, coverage rate, and calculation conventions.
The resulting series can be summarized by its mean, median, hit rate, variability, and rolling ICIRRolling ICIRThe mean information coefficient divided by its standard deviation over a trailing window, usually annualized. It measures the persistence of ranking skill across observations in the window.Open glossary entry →. Those summaries do not replace the underlying daily observations.
Use in signal and portfolio evaluation
IC tests the ordering supplied by a signal before portfolio construction. It does not include position sizes, covariance, neutralization constraints, turnover, borrowing costs, or market impact.
StrategyNet records IC observations for candidate factor-mimicking portfolios and examines their recent level and stability. Portfolio evaluation then adds weights, risk, constraints, and costs. A calculation report should retain both the IC evidence and the later portfolio results.
Frequently asked questions
Is IC calculated across securities or through time?
The usual factor-research calculation is across securities at one observation date. Repeating it through time produces a series of cross-sectional IC values.
Do I need to rank the inputs before calling Spearman correlation?
No. A standard Spearman implementation ranks the inputs internally. Manual ranking can still be useful when the ranking and tie conventions need separate inspection.
What happens when several securities have the same score?
Software commonly assigns average ranks to ties. Record the convention because coarse signals and quantile scores can produce many tied observations.
Is there a universal minimum number of securities?
No single cutoff applies to every test. Set a minimum before evaluation, report the valid count on every date, and examine whether results change with coverage.
Does a positive IC guarantee a profitable portfolio?
No. Portfolio results also depend on construction, risk, turnover, costs, capacity, and the number of independent decisions.
Next reading
- Information coefficient: measuring signal ranking performance
- Rank IC vs Pearson IC
- What Is a Meaningful Information Coefficient?
Sources
- Charles Spearman, “The Proof and Measurement of Association between Two Things”, The American Journal of Psychology, 1904.
- pandas
Series.corrdocumentation - SciPy
spearmanrdocumentation
This walkthrough is for research and educational purposes. It illustrates how strategynet.ai organizes signal evidence into factors and scenarios. It provides no recommendation, investment advice, or instruction to trade any security.
Back to Insights