
Rank IC vs Pearson IC
Rank IC measures the association between the ordering of signal scores and subsequent returns. Pearson IC measures their linear relationship using the raw values. Choosing between them determines whether the test evaluates ordering alone or also gives weight to the distances between observations.
The comparison below calculates both measures on the same data and shows how extreme observations affect them. It explains when each measure suits an investment rule and how differences between the two can guide further analysis.
Mathematical definitions
Let \(U_t\) be the eligible securities at observation time \(t\), \(f_{i,t}\) the point-in-time score for security \(i\), and \(R^{(b)}_{i,t\rightarrow t+h}\) its subsequent return over horizon \(h\) in base currency \(b\).
Pearson IC is the ordinary correlation of the raw values:
\[\operatorname{IC}^{\mathrm{Pearson}}_t = \frac{ \sum_{i\in U_t} (f_{i,t}-\overline{f}_t) (R^{(b)}_{i,t\rightarrow t+h}-\overline{R}_t) }{ \sqrt{ \sum_{i\in U_t}(f_{i,t}-\overline{f}_t)^2 \sum_{i\in U_t}(R^{(b)}_{i,t\rightarrow t+h}-\overline{R}_t)^2 } }.\]
Rank IC applies the same calculation after replacing both fields with their cross-sectional ranks:
\[\operatorname{IC}^{\mathrm{rank}}_t = \operatorname{corr}_{i\in U_t} \left( \operatorname{rank}(f_{i,t}), \operatorname{rank}(R^{(b)}_{i,t\rightarrow t+h}) \right).\]
Rank IC is therefore Spearman correlation. Pearson IC measures linear association in the reported values, while rank IC measures monotonic association in their ordering.
A numerical comparison
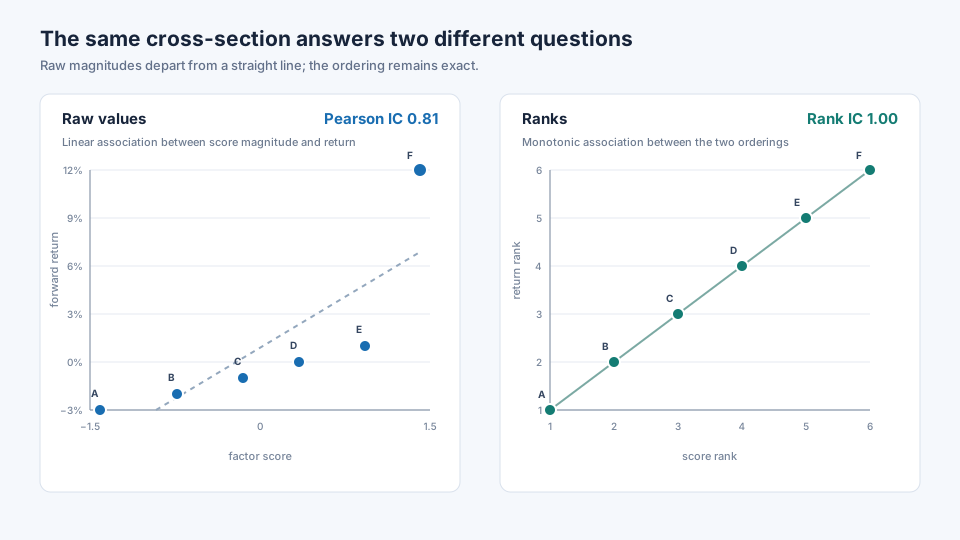
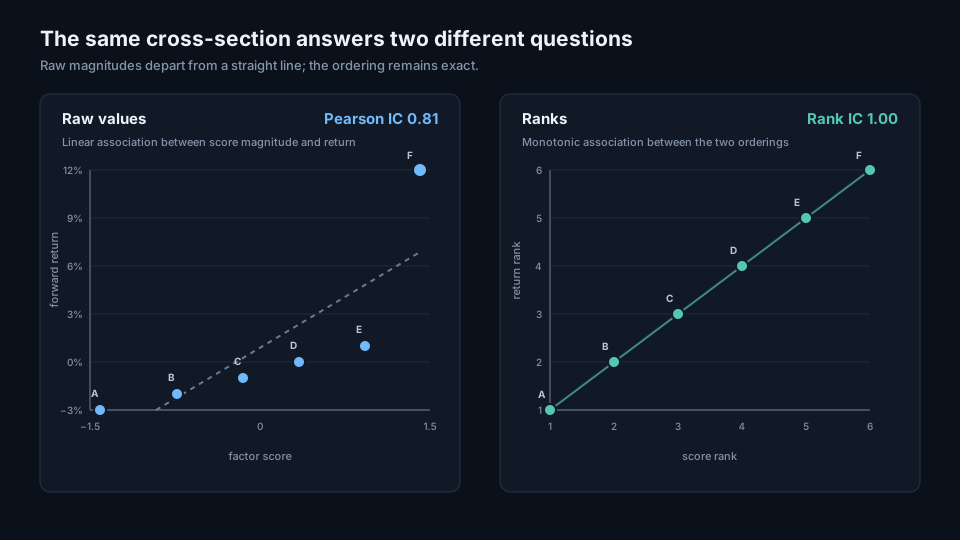
The six securities below have perfectly matching score and return ranks, but the top security has a much larger subsequent return than the rest.
The same cross-section measured two ways
| Security | Score | Forward return | Score rank | Return rank |
|---|---|---|---|---|
| A | −1.50 | −3.0% | 1 | 1 |
| B | −0.80 | −2.0% | 2 | 2 |
| C | −0.20 | −1.0% | 3 | 3 |
| D | 0.30 | 0.0% | 4 | 4 |
| E | 0.90 | +1.0% | 5 | 5 |
| F | 1.40 | +12.0% | 6 | 6 |
The rank ordering agrees exactly, giving \(\operatorname{IC}^{\mathrm{rank}}=1.00\). The raw relationship bends sharply at security F, so Pearson IC is lower at approximately \(0.81\).
The two results are both correct. Rank IC answers whether the ordering was preserved, and Pearson IC answers how closely the raw values followed a straight line.
Python calculation
from scipy.stats import pearsonr, spearmanr

scores = [-1.50, -0.80, -0.20, 0.30, 0.90, 1.40]
forward_returns = [-0.03, -0.02, -0.01, 0.00, 0.01, 0.12]

pearson_ic = pearsonr(scores, forward_returns).statistic
rank_ic = spearmanr(scores, forward_returns).statistic

print(f"Pearson IC: {pearson_ic:.2f}")  # Pearson IC: 0.81
print(f"Rank IC: {rank_ic:.2f}")        # Rank IC: 1.00
The production calculation must first align scores and forward returns by security and observation date, remove incomplete pairs according to a stated rule, and enforce the same minimum security count for both methods.
Interpreting positive, zero, and negative values
A positive Pearson IC indicates that larger raw scores tended to accompany larger subsequent returns through a linear relationship. A positive rank IC indicates that higher-scored securities tended to appear higher in the subsequent-return ordering.
A value near zero has a different meaning under each convention. Pearson IC near zero indicates little linear association, although a nonlinear relationship may still be present. Rank IC near zero indicates little monotonic agreement between the two orderings. Neither result, by itself, establishes statistical independence.
A negative coefficient reverses the stated direction. Negative Pearson IC means larger raw scores tended to accompany smaller returns in a linear sense. Negative rank IC means the score ordering tended to place lower-returning securities near the top.
Choosing the convention
Rank IC usually fits signals that are used through percentiles, quantiles, top and bottom groups, or other ordering rules. It also limits the effect of an extreme value once that value has been assigned its rank, although an unusual observation can still change the order.
Pearson IC is informative when the numerical distance between scores is part of the forecast. Examples include a calibrated expected-return estimate or a score whose magnitude directly affects position size. Its interpretation requires close inspection of outliers and the shape of the score-return relationship.
Research teams often retain both series. Rank IC can be the stated primary measure for an ordering signal, while Pearson IC provides a useful diagnostic for magnitude and influential observations. The primary convention should be chosen before reviewing the reported test period.
Common implementation mistakes
Calling raw correlation rank IC
Changing the label does not change the calculation. Rank IC requires ranks on both the score and return fields, either explicitly or through a Spearman implementation.
Ranking across several dates at once
Ranks must be formed within each observation date and its eligible universe. Ranking the complete history mixes different cross-sections and market periods.
Using different valid pairs
Pearson and rank IC should use the same joined observations when they are being compared. A difference caused by separate missing-value filters says little about the correlation convention.
Ignoring ties
Discrete scores, analyst categories, and quantile labels can create many ties. Record the tie method and the number of distinct score values in each cross-section.
Changing score direction during evaluation
The factor definition must state whether a larger score predicts a larger or smaller return. Reversing a disappointing sign after seeing the results changes the hypothesis.
Treating the larger coefficient as the winner
The two statistics answer different questions. Selection should follow the intended use of the signal, supported by stability, portfolio tests, and costs.
Relationship to adjacent terms
Cross-sectional rankingCross-sectional rankingOrdering securities against one another at the same observation time using a signal or characteristic.Open glossary entry → defines the ordering used by rank IC. Winsorization and standardization affect raw score magnitudes and can therefore change Pearson IC while leaving rank IC unchanged when the order is preserved. Neutralization can change both coefficients because it changes the cross-sectional score itself.
Rolling ICIRRolling ICIRThe mean information coefficient divided by its standard deviation over a trailing window, usually annualized. It measures the persistence of ranking skill across observations in the window.Open glossary entry → summarizes an IC series through time. Its input convention must remain fixed: a rank-IC history and a Pearson-IC history should be stored and interpreted separately.
Use in signal and portfolio evaluation
The selected IC convention belongs with the versioned signal definition. A research record should retain the method, eligible universe, forecast horizon, lag, tie rule, missing-value rule, and valid security count for every observation date.
For an ordering signal, rank IC measures whether the signal sorted subsequent returns in the intended direction. Portfolio evaluation then determines whether the ordering survived neutralization, position sizing, risk constraints, turnover, and costs. Pearson IC can help explain cases in which return magnitude was concentrated in a small part of the cross-section.
Frequently asked questions
Is Spearman correlation the same as rank IC?
Yes, when Spearman correlation is calculated across the eligible securities at one observation date using the signal scores and the stated forward returns.
Can Pearson IC and rank IC have different signs?
Yes. A few large observations can dominate raw covariance while the broader ordering points in the opposite direction. Such a result calls for inspection of the scatter plot, influence, coverage, and data quality.
Does ranking remove the effect of outliers?
Ranking removes the distance between an extreme value and the rest of the sample. The observation still occupies a rank and can affect the ordering, so its influence is reduced in one respect and remains present in another.
Should both coefficients be reported?
Reporting both is useful when their roles are stated in advance. The signal's intended use determines the primary measure, and the second coefficient helps diagnose the shape of the relationship.
Can the two coefficients be compared directly?
Both range from \(-1\) to \(1\), but their magnitudes describe different forms of association. A difference between them should prompt examination of the data instead of a mechanical preference for the larger number.
Next reading
- Should Information Coefficient Be Sector Neutral?
- Information coefficient: measuring signal ranking performance
- How to calculate information coefficient
Sources
- Charles Spearman, “The Proof and Measurement of Association between Two Things”, The American Journal of Psychology, 1904.
- SciPy
pearsonrdocumentation - SciPy
spearmanrdocumentation - NIST rank-correlation reference
This walkthrough is for research and educational purposes. It illustrates how strategynet.ai organizes signal evidence into factors and scenarios. It provides no recommendation, investment advice, or instruction to trade any security.
Back to Insights