
Should Information Coefficient Be Sector Neutral?
Sector-neutral information coefficient measures a signal's association with subsequent returns after accounting for sector effects. It helps researchers assess stock-selection evidence within sectors, while raw IC captures both within-sector and between-sector relationships.
The appropriate measurement follows the portfolio's investment mandate. This article compares raw, residualized, and within-sector IC and explains how reporting them together helps identify the source of a signal's measured performance.
Raw and sector-neutral definitions
For security \(i\) in the point-in-time eligible universe \(U_t\), let \(f_{i,t}\) be the signal observed at time \(t\) and let \(R_{i,t\rightarrow t+h}^{(b)}\) be its forward return over horizon \(h\) in base currency \(b\). Define the cross-sectional rank variables
\[x_{i,t}=\operatorname{rank}(f_{i,t}), \qquad y_{i,t}=\operatorname{rank}(R_{i,t\rightarrow t+h}^{(b)}).\]
The raw rank IC is
\[\rho_t^{\mathrm{raw}} = \operatorname{corr}_{i\in U_t}(x_{i,t},y_{i,t}).\]
Let \(g(i,t)\) be the security's sector as it was classified at time \(t\). Under equal-security weighting, remove each sector's cross-sectional rank mean:
\[\widetilde x_{i,t} =x_{i,t}-\overline{x}_{g(i,t),t}, \qquad \widetilde y_{i,t} =y_{i,t}-\overline{y}_{g(i,t),t}.\]
The residualized sector-neutral rank IC is
\[\rho_t^{\mathrm{sector}} = \operatorname{corr}_{i\in U_t} (\widetilde x_{i,t},\widetilde y_{i,t}).\]
This calculation ranks across the eligible universe first and then removes sector means from both rank fields. An equivalent regression implementation projects each rank field on the same point-in-time sector indicators and correlates the two residual vectors. The weighting rule used in those projections must be identical.
Other procedures also carry the sector-neutral label. A system can rank within each sector and pool the resulting percentile ranks, or calculate a separate IC inside every sector and aggregate the sector results. These choices are not generally equivalent when sector sizes, ties, or return dispersions differ. The method belongs in the factor specification rather than being left as a reporting default.
The within-sector and between-sector components
For any two cross-sectional variables \(x\) and \(y\), covariance can be decomposed by sector:
\[\operatorname{Cov}(x,y) = \sum_g p_g\operatorname{Cov}(x,y\mid g) + \operatorname{Cov}_g \left( \mathbb E[x\mid g], \mathbb E[y\mid g] \right),\]
where \(p_g\) is the sector's security weight. The first term collects within-sector association; the second records whether sectors with higher mean signal ranks also had higher mean return ranks. Applied to the rank variables, this decomposition explains why raw rank IC can look favorable even when every within-sector ordering is unfavorable.
Residualizing both rank fields against sector indicators removes the between-sector covariance under the stated weighting. The resulting correlation still depends on the dispersion of residual ranks and on the relative number of securities in each sector.
A sign reversal in eight securities
Consider a synthetic cross-section containing four Technology companies and four Utilities companies. Every Technology return exceeds every Utilities return, and every Technology score exceeds every Utilities score. Inside each sector, however, the score ordering is exactly reversed relative to returns.
Synthetic cross-section with opposing between- and within-sector rankings
| Security | Sector | Score | Forward return | Score rank | Return rank |
|---|---|---|---|---|---|
| T1 | Technology | 8 | +5.0% | 8 | 5 |
| T2 | Technology | 7 | +6.0% | 7 | 6 |
| T3 | Technology | 6 | +7.0% | 6 | 7 |
| T4 | Technology | 5 | +8.0% | 5 | 8 |
| U1 | Utilities | 4 | −4.0% | 4 | 1 |
| U2 | Utilities | 3 | −3.0% | 3 | 2 |
| U3 | Utilities | 2 | −2.0% | 2 | 3 |
| U4 | Utilities | 1 | −1.0% | 1 | 4 |
Across all eight companies, the sector separation produces raw rank IC of \(+0.5238\). After subtracting each sector's mean score rank and mean return rank, the residual order is perfectly reversed, giving sector-neutral rank IC of \(-1.0000\).
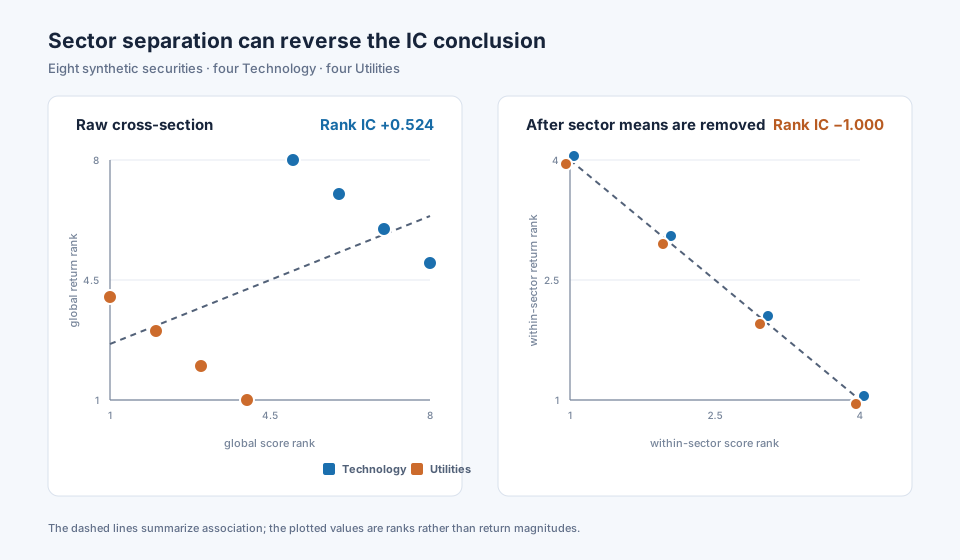
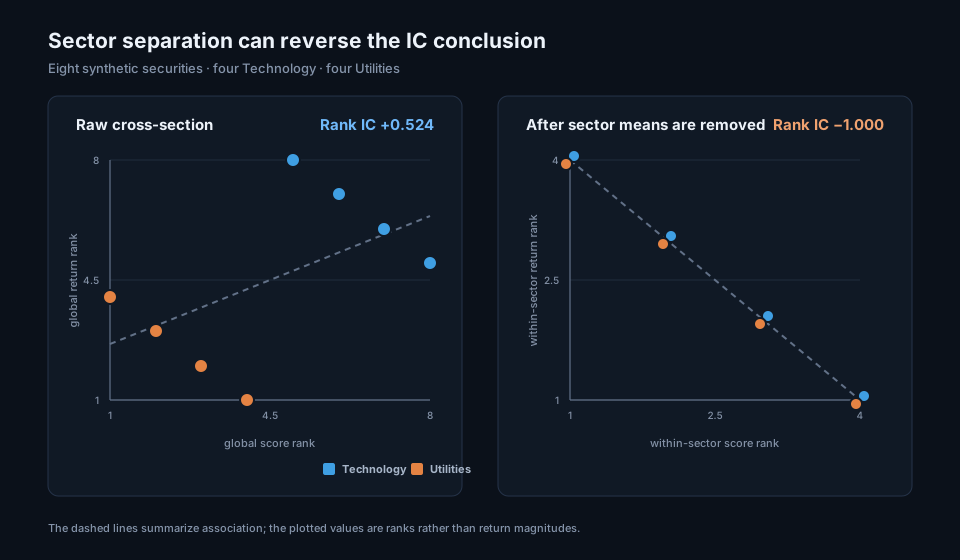
The example does not establish that sector effects are undesirable. If the registered thesis forecasts Technology relative to Utilities, the raw IC captures the intended information. If the thesis claims to select companies inside each sector, the neutral result shows that the measured evidence ran against that claim.
Python calculation
import pandas as pd

data = pd.DataFrame({
    "security": ["T1", "T2", "T3", "T4", "U1", "U2", "U3", "U4"],
    "sector": ["Technology"] * 4 + ["Utilities"] * 4,
    "score": [8, 7, 6, 5, 4, 3, 2, 1],
    "forward_return": [0.05, 0.06, 0.07, 0.08, -0.04, -0.03, -0.02, -0.01],
})

data["score_rank"] = data["score"].rank(method="average")
data["return_rank"] = data["forward_return"].rank(method="average")

data["score_rank_residual"] = (
    data["score_rank"]
    - data.groupby("sector")["score_rank"].transform("mean")
)
data["return_rank_residual"] = (
    data["return_rank"]
    - data.groupby("sector")["return_rank"].transform("mean")
)

raw_ic = data["score_rank"].corr(data["return_rank"])
sector_neutral_ic = data["score_rank_residual"].corr(
    data["return_rank_residual"]
)

print(f"Raw rank IC: {raw_ic:.4f}")
print(f"Sector-neutral rank IC: {sector_neutral_ic:.4f}")

# Raw rank IC: 0.5238
# Sector-neutral rank IC: -1.0000
Production code must join a point-in-time classification to each security before forming ranks. The example uses equal security weights, average ranks for ties, and complete pairs. A weighted residualization requires a weighted regression or weighted sector means throughout the calculation.
Interpreting the two signs
A positive raw IC indicates that the signal's total cross-sectional ordering aligned with subsequent returns. The result can arise through sector allocation, within-sector company selection, or both. A raw IC near zero can also hide two components with opposing signs.
A positive sector-neutral IC indicates that the residual or within-sector ordering aligned with residual return ranks. A value near zero records little remaining association after sector effects were removed. A negative result means that the company ordering within sectors ran against the registered signal direction.
Reading raw and sector-neutral IC together
| Raw IC | Sector-neutral IC | Likely interpretation to investigate |
|---|---|---|
| Positive | Positive | Sector allocation and within-sector ordering both contributed |
| Positive | Near zero or negative | Between-sector differences carried much of the raw association |
| Near zero or negative | Positive | Within-sector ordering was offset by sector positioning |
| Negative | Negative | Both total and residual ordering ran against the registered direction |
This table is diagnostic rather than causal. A sector label can proxy for many economic exposures, and the two IC values alone cannot identify which mechanism generated the result.
Which field should be neutralized?
Neutralizing both ranked scores and ranked forward returns asks whether the signal and return ordering covary after removing their sector means. It is the clearest symmetric definition of residualized IC.
Neutralizing only the signal creates sector-relative forecasts and then tests them against total returns. With equal-weighted linear residuals, the adjusted signal is orthogonal to sector indicators, but rank transformations, missing observations, and weighting differences can reintroduce a sector component. The result must be labeled as signal-neutralized IC.
Neutralizing only returns asks whether the original signal ranks sector-adjusted outcomes. That can be useful when the evaluation target is explicitly residual return, although the signal may still carry strong sector concentration. The evaluation record should retain the adjusted field, controls, and operation order rather than referring to all three methods as the same statistic.
Sector, industry, and other control levels
Sector is a broad classification. GICS, for example, is hierarchical: sector, industry group, industry, and sub-industry. A signal may appear neutral at the sector level while concentrating heavily in one industry inside the sector. Narrower groups improve peer comparability but reduce the number of securities available to estimate each group effect.
Country, region, size, currency, listing venue, and style exposures can also create group-level association. Removing sectors alone does not make a signal independent of those controls. A multi-control regression can residualize ranks against sector indicators and continuous exposures together, provided every control was known at the observation time and the design matrix remains estimable.
Statistical limitations
Sector-neutralization consumes cross-sectional information. A group containing one valid company has no within-sector variation, and a very small group can produce unstable ranks or correlations. The specification needs a minimum group size and a rule for companies with missing or unclassified membership.
Pooled residual IC weights sectors through their valid security counts and residual dispersion. An equal-weighted average of sector-level IC values gives small and large sectors equal influence. A market-cap-weighted method answers a third question. Report the aggregation rule and valid count by sector.
As with raw IC, inference concerns the history of date-level results rather than one cross-section. Overlapping forward returns and persistent sector conditions can make the IC series serially dependent. Confidence intervals for mean raw and neutral IC should use the same completed dates and a dependence-aware method.
Comparing many classifications, hierarchy levels, weighting schemes, and neutralization controls creates specification search. Register the primary method before evaluation and use later data to assess any alternative selected after inspection.
Common implementation mistakes
Joining today's classification to historical observations
Companies move between classifications and classification systems themselves change. Historical scores require the sector assignment available at each observation time. Applying a current label to the full history can alter group means with information that was unavailable then.
Mixing the order of ranking and neutralization
Ranking globally and then residualizing ranks, residualizing raw scores and then ranking, and ranking within sectors can produce different results. The operation order, tie method, and weights must be fixed and named.
Removing sectors from only one field without saying so
Signal-neutralized, return-neutralized, and symmetric residual IC answer related questions. An unlabeled “neutral IC” leaves the target ambiguous.
Allowing small groups to dominate
A sector-level correlation based on three securities has very different precision from one based on 200. Minimum valid counts and aggregation weights should be visible beside the result.
Assuming neutral IC creates a neutral portfolio
IC is a correlation statistic. Position sizing, security covariance, missing names, constraints, and later price moves can all create sector exposure in the portfolio. Exposure limits belong in portfolio construction and monitoring.
Removing information that belongs to the thesis
A macro signal may deliberately forecast sectors, industries, or countries. Neutralizing that component changes the hypothesis. The choice should follow the economic claim and intended portfolio mandate.
Treating a higher neutral IC as automatic improvement
Neutralization can reduce noise, and it can also narrow the opportunity set, increase turnover, or remove a return source. Walk-forward portfolio results under the intended constraints determine the implementation effect.
Relationship to adjacent measures
Raw information coefficient measures total cross-sectional association under the registered score and return definitions. Rank IC provides the ordering convention used here. IC reliability governs the time-series evidence required before either mean is treated as persistent.
Factor exposureFactor exposureThe sensitivity of a security or portfolio to a specified factor, estimated from holdings, characteristics, or a return model.Open glossary entry → describes sensitivity in the constructed portfolio. Sector-neutral IC removes a group component from an evaluation statistic, whereas a sector constraint limits portfolio exposure after expected returns and covariance have been supplied. These controls can be aligned while remaining separate records.
Information Ratio measures benchmark-relative portfolio return per unit of tracking error. A sector-neutral IC can become more relevant to that portfolio result when the portfolio mandate tightly limits sector bets, although turnover, costs, and the transfer through constraints still intervene.
How StrategyNet records neutralization
StrategyNet treats the neutralization rule as part of the versioned factor definition. The record identifies the classification source and level, its point-in-time date, the fields adjusted, the rank and residualization order, the weighting method, minimum group size, missing-membership rule, and any additional controls.
Raw and sector-neutral IC histories can then be compared over the same dates, universe, forward-return horizon, and signal version. Portfolio construction stores sector exposure constraints separately, allowing the researcher to see whether the within-sector signal survived covariance-aware position sizing, turnover controls, and costs. This links the user's chosen research question to the resulting portfolio without merging the two stages.
Frequently asked questions
Should every equity factor use sector-neutral IC?
No. Use it when within-sector selection is the intended claim or when sector exposure will be tightly constrained. A signal designed to forecast sector rotation needs its raw component evaluated as well.
Is sector-neutral IC usually lower than raw IC?
Either value can be higher. Neutralization removes a component that may have supported, opposed, or added noise to the raw association.
Should scores, returns, or both be sector neutralized?
Residualizing both ranked fields gives a symmetric within-sector association. Adjusting one field can answer a valid alternative question when that target is stated explicitly.
Is sector-neutral IC the average IC across sectors?
It can be defined that way, but the residualized pooled correlation used in this article is a different calculation. Sector-level averaging needs its own group weights and minimum sample rule.
Does sector-neutral IC guarantee sector-neutral holdings?
No. Holdings require explicit exposure constraints and ongoing measurement during portfolio construction and rebalancing.
Should sector or industry be used?
Use the peer level that fits the signal's economic claim and leaves enough valid companies per group. Reporting sensitivity across one broader and one narrower classification can reveal whether the conclusion depends on that boundary.
Next reading
- From Information Coefficient to Portfolio Weights
- Information Coefficient vs Information Ratio
- Factor exposure: security and portfolio sensitivity
Sources
- Clifford S. Asness, R. Burt Porter, and Ross L. Stevens, “Predicting Stock Returns Using Industry-Relative Firm Characteristics”, 2000.
- Tobias J. Moskowitz and Mark Grinblatt, “Do Industries Explain Momentum?”, The Journal of Finance, 1999.
- Ragnar Frisch and Frederick V. Waugh, “Partial Time Regressions as Compared with Individual Trends”, Econometrica, 1933.
- MSCI and S&P Dow Jones Indices, Global Industry Classification Standard.
This walkthrough is for research and educational purposes. It illustrates how strategynet.ai organizes signal evidence into factors and scenarios. It provides no recommendation, investment advice, or instruction to trade any security.
Back to Insights