
Information Coefficient vs Hit Rate
Mean information coefficient summarizes the strength and direction of a signal's measured association with subsequent returns across observation dates. IC hit rate records the proportion of those dates with a positive IC. Together, they show how the size and frequency of favorable observations contribute to the signal's history.
This article calculates both statistics for example histories and explains how large adverse observations can offset many small positive ones. It also defines the observation unit for IC, security-level, and portfolio hit rates so that each result can be interpreted consistently.
Defining IC and IC hit rate
For security \(i\) in the point-in-time eligible universe \(U_t\), let \(f_{i,t}\) be the signal available at observation time \(t\) and let \(R_{i,t\rightarrow t+h}^{(b)}\) be its forward return over horizon \(h\) in base currency \(b\). The date-level rank IC is
\[\rho_t = \operatorname{corr}_{i\in U_t} \left( \operatorname{rank}(f_{i,t}), \operatorname{rank}(R_{i,t\rightarrow t+h}^{(b)}) \right).\]
The signal direction is registered so that positive \(\rho_t\) represents the intended relationship. Across \(T\) completed observation dates, mean IC is
\[\overline{\rho} = \frac{1}{T}\sum_{t=1}^{T}\rho_t.\]
Define the date-level hit indicator as
\[H_t=\mathbf 1\{\rho_t>0\}.\]
The IC hit rate is
\[\widehat p_{\mathrm{hit}} = \frac{1}{T}\sum_{t=1}^{T}H_t.\]
This is the convention used for StrategyNet signal evaluation: a zero IC counts as a miss. An alternative system might exclude zeros or assign them half a hit. The chosen rule affects short samples and must be stated with the result.
Both calculations require the same IC convention, signal version, observation time, eligible universe, forward-return horizon, lag, currency, missing-value rule and minimum valid security count. A hit rate assembled from differently defined IC observations has no coherent interpretation.
Two histories that reverse the ranking
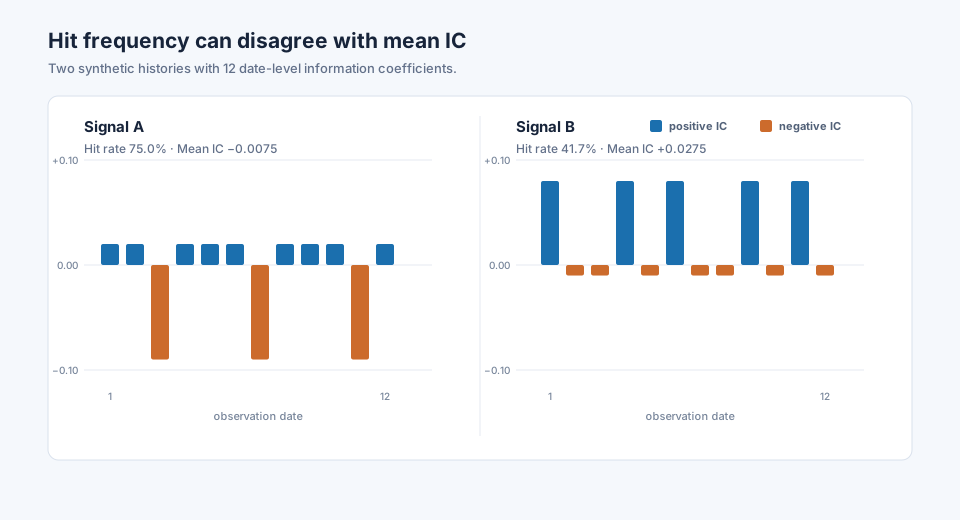
Consider two synthetic 12-date histories:
Synthetic date-level information coefficient histories
| Signal | IC observations | Positive dates | IC hit rate | Mean IC |
|---|---|---|---|---|
| A | Nine at +0.02; three at −0.09 | 9 of 12 | 75.0% | −0.0075 |
| B | Five at +0.08; seven at −0.01 | 5 of 12 | 41.7% | +0.0275 |
Signal A has the higher hit rate, but its three adverse observations outweigh the nine modest positive observations. Signal B misses more often, yet the positive observations are large enough to produce a positive mean. The example contains the same number of dates for each signal and changes only the balance between frequency and magnitude.
Python calculation
from math import sqrt
from statistics import mean

histories = {
    "Signal A": [
        0.02, 0.02, -0.09, 0.02, 0.02, 0.02,
        -0.09, 0.02, 0.02, 0.02, -0.09, 0.02,
    ],
    "Signal B": [
        0.08, -0.01, -0.01, 0.08, -0.01, 0.08,
        -0.01, -0.01, 0.08, -0.01, 0.08, -0.01,
    ],
}

def wilson_interval(hits, total, z=1.96):
    proportion = hits / total
    denominator = 1 + z * z / total
    center = (proportion + z * z / (2 * total)) / denominator
    half_width = z / denominator * sqrt(
        proportion * (1 - proportion) / total + z * z / (4 * total * total)
    )
    return center - half_width, center + half_width

for name, ic in histories.items():
    hits = sum(value > 0 for value in ic)
    interval = wilson_interval(hits, len(ic))
    print(
        name,
        "mean", round(mean(ic), 4),
        "hit rate", round(hits / len(ic), 4),
        "95% interval", tuple(round(value, 4) for value in interval),
    )

# Signal A mean -0.0075 hit rate 0.75 95% interval (0.4677, 0.9111)
# Signal B mean  0.0275 hit rate 0.4167 95% interval (0.1933, 0.6805)
Twelve observations leave substantial uncertainty around either hit rate. The Wilson intervals in the code are useful descriptive intervals for independent Bernoulli trials. Overlapping return windows and persistent market conditions can cluster IC signs through time, requiring a block bootstrap or another dependence-aware method for empirical results.
What the sign and level mean
Mean IC ranges from \(-1\) to \(1\). A positive value indicates that higher signal ranks were associated on average with higher forward-return ranks under the registered direction. A mean near zero can arise from consistently weak relationships or from offsetting positive and negative periods. A negative mean indicates that the average association ran against the registered direction.
IC hit rate ranges from \(0\) to \(1\). A value of \(0.70\) means that 70% of the included dates produced a strictly positive IC. The statistic contains no information about the size of those positive observations, the size of the remaining negative observations, or the number of securities in each cross-section.
Under a symmetric null distribution for date-level IC, independent observations and a stated treatment of zeros, \(50\%\) is a natural reference for IC-sign hit rate. Other hit-rate statistics require their own benchmarks. A security-level direction test can exceed 50% simply because positive returns were more common in the sample.
Three statistics often called hit rate
IC-sign hit rate
This article's primary definition counts dates for which the factor's cross-sectional IC has the intended sign:
\[\frac{1}{T}\sum_t\mathbf 1\{\rho_t>0\}.\]
It answers: on what share of evaluation dates did the signal order the cross-section in the registered direction?
Security-level directional accuracy
When a model produces a signed return forecast \(\widehat R_{i,t}\), directional accuracy can be defined as
\[\frac{ \sum_t\sum_{i\in U_t} \mathbf 1\{\operatorname{sign}(\widehat R_{i,t}) =\operatorname{sign}(R_{i,t\rightarrow t+h})\} }{ \sum_t N_t }.\]
A pure cross-sectional rank supplies no zero-return threshold. Converting ranks into long and short directions requires a declared cutoff, such as top and bottom quantiles, and changes the question being measured.
Portfolio winning-period rate
A candidate portfolio can report the fraction of net return periods above a chosen threshold:
\[\frac{1}{T}\sum_t\mathbf 1\{R_{p,t}^{net}>R_{threshold,t}\}.\]
This result depends on weights, constraints, trading, costs and the reporting frequency. It describes the portfolio path after construction. It should carry a label such as “positive monthly return rate” or “benchmark-relative winning weeks” so that its denominator and threshold are visible.
Why 50% may be the wrong directional baseline
Suppose 65% of security returns are positive and a forecasting rule predicts a positive return for every security. Its directional accuracy is 65%, although the rule has supplied no cross-sectional discrimination. The marginal frequency of predicted and realized signs determines the success rate expected under independence.
Tests of directional predictive performance can compare observed success with that independence benchmark. For factor ranks, IC already evaluates whether the predicted ordering and realized-return ordering are associated across the whole cross-section, which avoids selecting an arbitrary zero-return cutoff. Security-level directional accuracy can still be useful when the model truly forecasts signed outcomes and its baseline is reported correctly.
Uncertainty in IC hit rate
If \(H_t\) were independent Bernoulli observations with success probability \(p\), then
\[\operatorname{SE}(\widehat p) = \sqrt{\frac{\widehat p(1-\widehat p)}{T}}.\]
The normal interval built directly from this standard error performs poorly in small samples and near zero or one. A Wilson score interval or an exact binomial interval stays within the admissible range and is generally preferable for the independent-trial case.
Daily IC hits are often dependent. Multi-day forward returns overlap, factor relationships persist, and market regimes can produce sequences of hits or misses. An independent binomial test then overstates the effective sample size. Resampling contiguous blocks of the date-level IC series preserves some of that clustering and can be used to estimate an interval for the hit rate.
Inference for mean IC and hit rate should use the same completed evaluation period and a method appropriate to each statistic. The two intervals answer separate questions: uncertainty around average correlation magnitude and uncertainty around positive-sign frequency.
Common implementation mistakes
Leaving the hit definition unstated
“Hit rate” can refer to positive IC dates, correctly signed security returns, positive quantile spreads, profitable trades or winning portfolio periods. Every report needs the event, threshold, frequency and denominator.
Counting security rows as independent dates
IC-sign hit rate has one binary observation per date-level cross-section. A universe of 2,000 securities improves the estimation of that date's IC while still producing one hit outcome for the date.
Omitting zero and missing-value rules
Zero IC can be counted as a miss, excluded, or assigned a fractional score. Missing dates and cross-sections below the minimum valid count need separate treatment. These choices should be fixed before evaluation.
Reversing a factor after observing its misses
The signal direction belongs to the registered specification. Flipping the factor after reading its hit rate creates a new version whose performance must be assessed in a later sample.
Comparing hit rates with different frequencies
A daily IC hit rate, monthly portfolio winning rate and per-trade success rate have different observation units and dependence. Direct comparison of their percentages is invalid.
Ignoring the size of misses
A high hit rate can coexist with a negative mean IC, a poor quantile spread or large portfolio drawdowns. Inspect the date-level distribution and the portfolio loss profile alongside the count of successful dates.
Relationship to adjacent measures
Mean IC magnitude uses every date-level correlation value. IC reliability asks how precisely the mean is estimated under the observed dependence. IC hit rate records only the sign frequency, so it can reveal whether a positive mean was broad or concentrated without replacing those magnitude and uncertainty measures.
Rolling ICIR divides rolling mean IC by the standard deviation of the IC series. A history with frequent small positive IC and occasional large negative IC can have a high hit rate and an unattractive ICIR because the adverse observations affect both its mean and variability.
Quantile spread records the return difference between selected high- and low-score groups. Its sign hit rate depends on quantile construction and weights. Portfolio information ratio evaluates active return relative to tracking error after the signal has passed through construction.
How StrategyNet uses the two measures
StrategyNet calculates IC hit rate from the same date-level IC history used for mean IC and rolling ICIR. A hit is a strictly positive IC after the factor's direction has been registered. The evaluation record retains the signal version, universe, observation time, return horizon, lag, currency, coverage, valid date count and individual IC observations.
Signal Studio can therefore distinguish a factor that worked modestly on many dates from one whose positive average came from fewer, stronger episodes. The candidate then proceeds to spread analysis and walk-forward portfolio tests, where turnover, costs, risk, drawdown and portfolio winning-period rates are calculated under their own explicit definitions.
Frequently asked questions
Is a 60% IC hit rate good?
The answer depends on the number and dependence of the dates, the corresponding mean IC, the size of adverse observations, the forecast horizon and later portfolio results. Report an interval and the complete IC distribution.
Can hit rate be below 50% when mean IC is positive?
Yes. Signal B in the example has a 41.7% hit rate and a mean IC of \(0.0275\) because its positive correlations are larger than its negative correlations.
Should a zero IC count as a hit?
StrategyNet counts strictly positive date-level IC as a hit, so zero is a miss. Other conventions are possible when they are declared in advance and applied consistently.
Is IC hit rate the percentage of securities predicted correctly?
No. IC hit rate has one outcome per cross-sectional observation date. A security-level directional accuracy measure requires signed forecasts and has one outcome per eligible security-date pair.
Does a high hit rate imply a profitable strategy?
Profitability depends on the magnitude and dispersion of returns, position sizing, constraints, turnover, costs and losses during unsuccessful periods. Hit rate supplies one diagnostic within that broader evaluation.
Next reading
- Information Coefficient vs Information Ratio
- Information coefficient: measuring signal ranking performance
- When Is an Information Coefficient Reliable?
Sources
- Charles Spearman, “The Proof and Measurement of Association between Two Things”, The American Journal of Psychology, 1904.
- Edwin B. Wilson, “Probable Inference, the Law of Succession, and Statistical Inference”, Journal of the American Statistical Association, 1927.
- M. Hashem Pesaran and Allan Timmermann, “A Simple Nonparametric Test of Predictive Performance”, Journal of Business & Economic Statistics, 1992.
- SciPy
binomtestdocumentation
This walkthrough is for research and educational purposes. It illustrates how strategynet.ai organizes signal evidence into factors and scenarios. It provides no recommendation, investment advice, or instruction to trade any security.
Back to Insights