
What Is a Meaningful Information Coefficient?
A useful information coefficient reflects a forecast relationship that repeats across enough investment opportunities to contribute to a portfolio after risk controls and costs. Its practical value depends on the strength and persistence of that relationship, the independence of the opportunities, and the cost of trading them.
This article explains how to assess IC magnitude in that context. It compares signal histories and relates the estimates to uncertainty, breadth, and portfolio implementation, giving researchers a basis for judging how much reliance to place on a measured IC.
The quantities being interpreted
For an eligible universe \(U_t\), let the date-level rank IC be
\[\rho_t = \operatorname{corr}_{i\in U_t} \left( \operatorname{rank}(f_{i,t}), \operatorname{rank}(R_{i,t\rightarrow t+h}^{(b)}) \right),\]
where \(f_{i,t}\) is the point-in-time signal, \(R_{i,t\rightarrow t+h}^{(b)}\) is the forward return over horizon \(h\) in base currency \(b\), and all pairs use the same missing-value and eligibility rules.
Across \(T\) completed observation dates, the sample mean and standard deviation are
\[\widehat{\mu}_{IC}=\frac{1}{T}\sum_{t=1}^{T}\rho_t, \qquad \widehat{\sigma}_{IC} = \sqrt{ \frac{1}{T-1} \sum_{t=1}^{T}(\rho_t-\widehat{\mu}_{IC})^2 }.\]
A reported mean of \(0.03\) says that the average cross-sectional association was positive under this specification. It says nothing by itself about how widely the individual observations varied, how many independent dates were observed, or how the scores translated into positions.
Two IC histories with the same mean
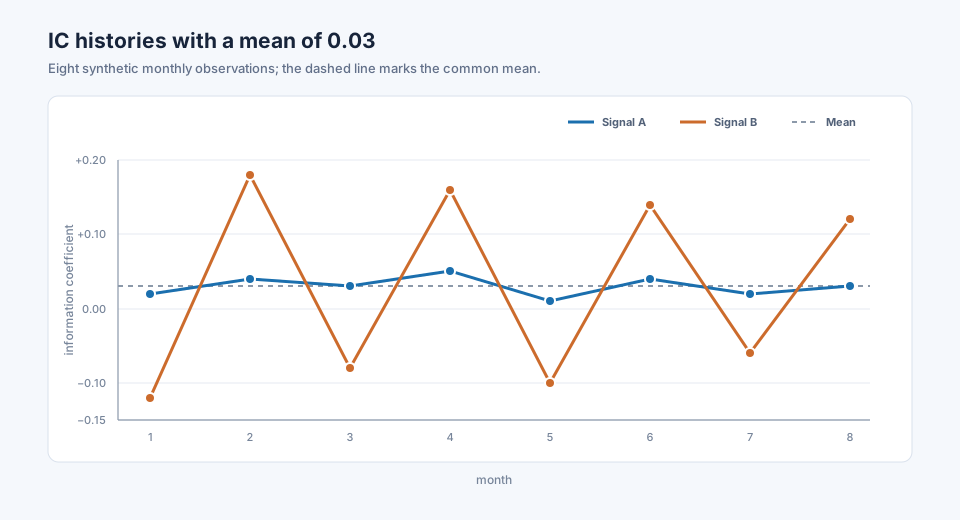
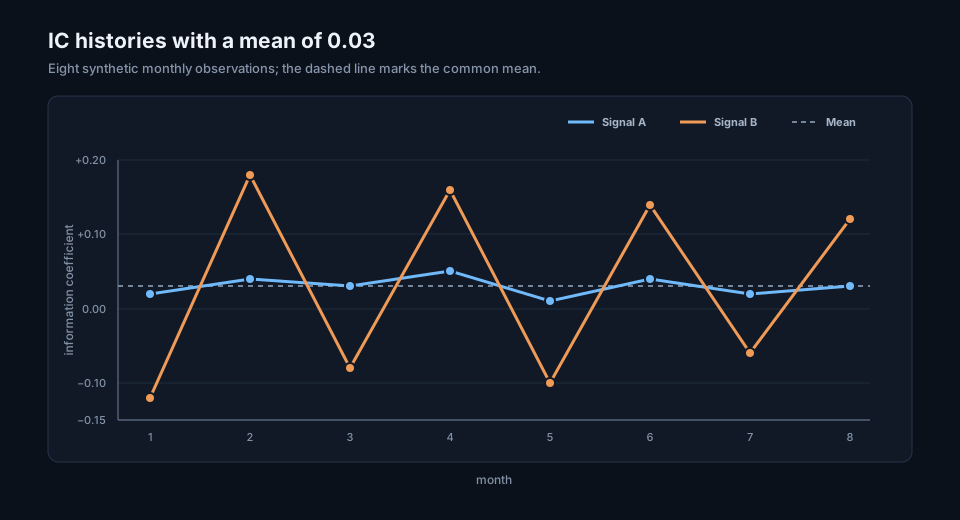
The following synthetic monthly histories both have a mean IC of \(0.03\). Signal A stays close to that mean, while Signal B repeatedly changes direction.
Synthetic information coefficients over eight completed months
| Month | Signal A | Signal B |
|---|---|---|
| 1 | +0.02 | −0.12 |
| 2 | +0.04 | +0.18 |
| 3 | +0.03 | −0.08 |
| 4 | +0.05 | +0.16 |
| 5 | +0.01 | −0.10 |
| 6 | +0.04 | +0.14 |
| 7 | +0.02 | −0.06 |
| 8 | +0.03 | +0.12 |
Signal A has a sample standard deviation of approximately \(0.0131\), compared with \(0.1305\) for Signal B. Their unannualized mean-to-standard-deviation ratios are therefore about \(2.29\) and \(0.23\). Eight observations are far too few for a serious inference; the example isolates why a mean IC cannot be interpreted without its history.
Python calculation
from statistics import mean, stdev

histories = {
    "Signal A": [0.02, 0.04, 0.03, 0.05, 0.01, 0.04, 0.02, 0.03],
    "Signal B": [-0.12, 0.18, -0.08, 0.16, -0.10, 0.14, -0.06, 0.12],
}

for name, ic in histories.items():
    mean_ic = mean(ic)
    ic_std = stdev(ic)
    mean_to_std = mean_ic / ic_std
    print(name, round(mean_ic, 4), round(ic_std, 4), round(mean_to_std, 2))

# Signal A 0.03 0.0131 2.29
# Signal B 0.03 0.1305 0.23
Interpreting magnitude and sign
A positive mean IC indicates that higher signal scores were generally associated with higher forward-return ranks in the stated sample. A value near zero indicates little average monotonic association, although it can also result from offsetting positive and negative periods. A persistently negative IC indicates that the registered orientation may be reversed or that the economic relationship worked in the opposite direction during the sample.
The distance from zero measures association rather than return. An IC of \(0.05\) is not five percentage points of performance, and daily IC should not be annualized by multiplying it by 252. Correlation remains dimensionless. Its economic effect depends on the opportunities available to express it and on the return dispersion, risks and costs attached to those opportunities.
For this reason, fixed verbal bands such as “weak,” “moderate” and “strong” are usually misleading in factor research. The same numerical value can describe a useful result in one experiment and an unstable result in another.
Conditions that make an IC meaningful
The hypothesis and direction were fixed in advance
The signal definition must state whether larger scores forecast larger or smaller returns. Reversing the sign after observing the test converts a failed directional hypothesis into a selected result.
The result repeats outside the development sample
The mean should remain reasonably stable across walk-forward periods, market conditions, liquidity groups and modest changes to the universe. This does not require identical IC in every period; it requires evidence that the average is not carried by a few favourable dates or securities.
The observations supply effective breadth
The fundamental law of active management relates the information ratio to forecasting skill and breadth in an idealized setting:
\[\operatorname{IR}\approx IC\sqrt{BR},\]
where \(BR\) is the number of independent forecasting opportunities. Hundreds of securities or daily observations do not automatically provide hundreds of independent decisions. Common factor exposures, serial correlation and overlapping return labels reduce effective breadth.
The original relationship uses a forecast-return correlation that is consistent with the portfolio construction. Rank IC is often a useful diagnostic for ordering signals, but it should not be substituted mechanically for a differently defined IC inside this planning relationship.
Portfolio construction preserves the forecast
Constraints can prevent the portfolio from expressing the signal as designed. An extension of the fundamental law introduces the transfer coefficient \(TC\):
\[\operatorname{IR}\approx TC\times IC\sqrt{BR}.\]
The transfer coefficient measures the alignment between the unconstrained forecast and the active positions produced under the portfolio constraints. A positive IC can have little portfolio effect when neutrality, concentration, liquidity or turnover limits remove most of the intended ordering.
The result survives implementation costs
IC is calculated before position size, turnover, spread, market impact, borrow and capacity are applied. The corresponding candidate strategy must therefore be tested under an execution convention and cost model appropriate to the forecast horizon. A short-lived signal can require enough trading to consume the return associated with its ranking ability.
Common interpretation errors
Applying one threshold to every experiment
Comparisons require the same IC convention, universe, horizon, lag, currency, coverage rule and evaluation period. A threshold copied from another market or frequency has no dependable meaning when these elements change.
Comparing a single-date IC with a historical mean
A cross-section can produce an unusually large positive or negative IC on one date. A mean IC summarizes many completed dates. They describe different objects and should carry explicit labels in tables and charts.
Counting nominal observations as independent observations
Five-day forward returns calculated every day overlap. Securities exposed to the same market and sectors are also dependent within a cross-section. Both forms of dependence affect uncertainty and the amount of genuine breadth.
Selecting the best horizon or universe after seeing the result
Searching many horizons, transformations and universes increases the chance of finding an attractive mean by chance. The selected specification needs a new out-of-sample period or an inference method that accounts for the search.
Stopping at gross signal statistics
Mean IC, ICIR and hit rate describe the forecast history. Candidate returns, turnover, drawdown, transfer statistics and net performance describe how a construction rule used that forecast. Portfolio evaluation needs both records.
Relationship to adjacent measures
Rank IC and Pearson IC measure different forms of association, so their magnitudes should be interpreted within the chosen convention. Rolling ICIR divides a rolling mean IC by its variability and is useful for examining persistence, although a short or highly dependent window can still produce an unstable estimate.
IC hit rate records the fraction of dates with the desired IC sign and ignores the magnitude of each observation. The information ratio uses portfolio active return and tracking error rather than cross-sectional signal correlation. Transfer coefficient and effective breadth explain why IC cannot be carried directly into a portfolio-return claim.
How magnitude enters StrategyNet evaluation
StrategyNet retains the date-level IC series together with its signal version, universe, horizon, lag and coverage. Mean IC and rolling ICIR can be compared with the component history and valid security counts. Current factor score and rank remain separate because they describe the latest eligible cross-section rather than historical efficacy.
Candidate-strategy tests then introduce a construction method, temporal contract, rebalance schedule, costs and risk controls. Portfolio optimization adds covariance estimates and explicit constraints. An IC estimate becomes decision-relevant only through this chain of recorded assumptions and results.
Frequently asked questions
Is an IC of 0.05 meaningful?
It may be. The number needs its convention, horizon, universe, sample period, dispersion, coverage and out-of-sample history. The resulting strategy must also survive constraints and estimated costs.
Can a low IC support a useful strategy?
Yes. A modest but persistent association can contribute when the strategy has broad independent opportunities, low implementation loss and manageable costs.
Can a high IC produce poor portfolio results?
Yes. Concentration in a few dates, unstable coverage, factor overlap, constraints, turnover and market impact can prevent a large historical IC from becoming a robust net return.
Does a statistically significant IC have economic value?
Statistical evidence concerns whether the estimated relationship is difficult to explain by sampling variation under the chosen model. Economic value also depends on breadth, risk, capacity, implementation and costs.
Should negative IC be converted to positive IC?
The registered direction should remain unchanged during evaluation. A stable negative result can motivate a separately versioned inverse hypothesis, which then requires its own out-of-sample test.
Next reading
- Information coefficient: measuring signal ranking performance
- Rank IC vs Pearson IC
- When Is an Information Coefficient Reliable?
- Rolling ICIR: measuring the persistence of signal ranking
Sources
- Richard C. Grinold, “The Fundamental Law of Active Management”, The Journal of Portfolio Management, 1989.
- Roger Clarke, Harindra de Silva and Steven Thorley, “Portfolio Constraints and the Fundamental Law of Active Management”, Financial Analysts Journal, 2002.
- Charles Spearman, “The Proof and Measurement of Association between Two Things”, The American Journal of Psychology, 1904.
- SciPy
spearmanrdocumentation
This walkthrough is for research and educational purposes. It illustrates how strategynet.ai organizes signal evidence into factors and scenarios. It provides no recommendation, investment advice, or instruction to trade any security.
Back to Insights