
What Is Cross-Sectional Ranking?
Cross-sectional ranking records where each security's measurement stands relative to its peers at the same observation time. It puts inputs such as valuation ratios, price changes, and analyst revisions on a common scale so that researchers can compare or combine them.
Ranking retains order and discards the distances between values. This reduces the influence of extreme observations and makes the choice of peer universe central to interpretation. The worked example below explains the calculation, ties, and the effect of changing the eligible securities.
Mathematical definition
Let \(U_t\) be the point-in-time eligible universe and \(x_{i,t}\) a valid observation for security \(i\). Write \(r_{i,t}\) for its ascending rank among the \(N_t\) valid observations, with average ranks assigned to ties. A centred rank on \([-1,+1]\) is
\[q_{i,t} = 2\left(\frac{r_{i,t}-1}{N_t-1}\right)-1.\]
The smallest value receives \(-1\), the largest receives \(+1\), and the middle rank receives zero when \(N_t\) is odd. If a larger raw value represents a less desirable outcome, reverse the orientation:
\[q^{\mathrm{oriented}}_{i,t}=-q_{i,t}.\]
Other percentile conventions are also used, including \(r/N\) and \((r-0.5)/N\). They differ most in small universes and at the endpoints. The chosen convention, tie rule, and missing-value treatment are part of the factor definition.
Worked example with a tie and an outlier
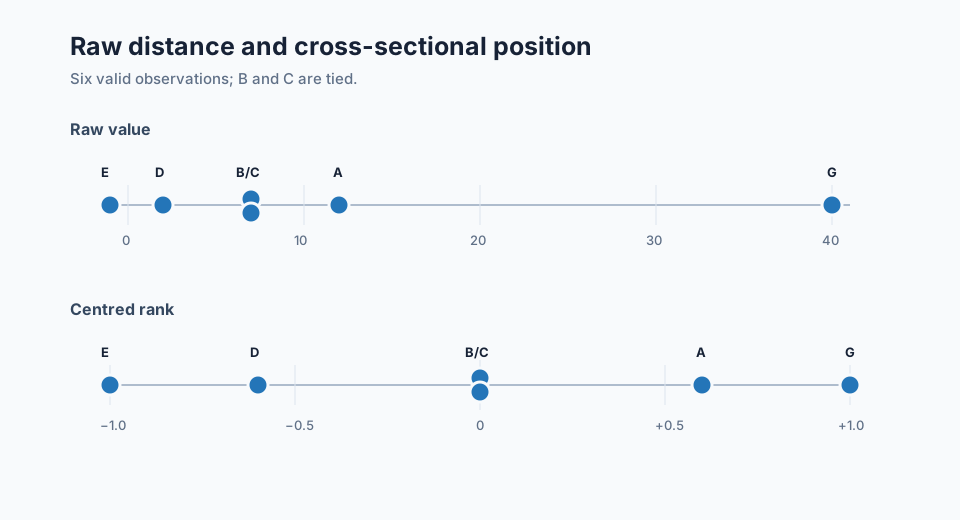
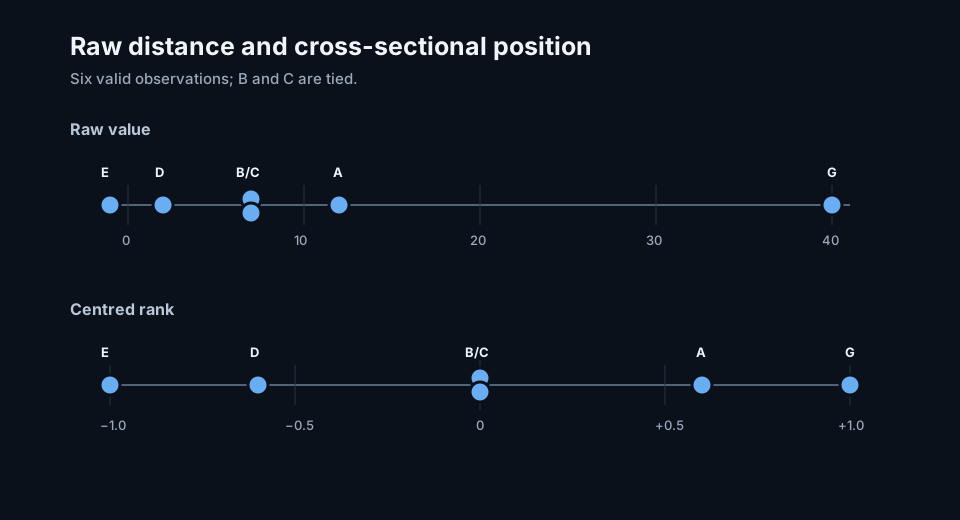
Suppose seven securities enter an initial universe. F has no valid observation, so six values remain for the ranking calculation. B and C are tied at 7, and G has the extreme raw value 40.
Cross-sectional ranking of six valid observations
| Security | Raw value | Average rank | Centred rank |
|---|---|---|---|
| E | −1 | 1.0 | −1.0 |
| D | 2 | 2.0 | −0.6 |
| B | 7 | 3.5 | 0.0 |
| C | 7 | 3.5 | 0.0 |
| A | 12 | 5.0 | +0.6 |
| G | 40 | 6.0 | +1.0 |
| F | missing | — | missing |
B and C occupy the third and fourth ordered positions, so each receives the average rank \((3+4)/2=3.5\). Their centred value is
\[2\left(\frac{3.5-1}{6-1}\right)-1=0.\]
The raw gap from A to G is 28, while the gap from B to A is only 5. The centred rank gaps are both 0.4. Ranking preserves order and deliberately discards the raw distances.
Python calculation
import pandas as pd

raw = pd.Series(
    {"A": 12.0, "B": 7.0, "C": 7.0, "D": 2.0,
     "E": -1.0, "F": None, "G": 40.0}
)

valid = raw.dropna()
rank = valid.rank(method="average", ascending=True)
centred_rank = 2 * (rank - 1) / (valid.count() - 1) - 1

result = pd.DataFrame({"raw": valid, "rank": rank, "centred": centred_rank})
print(result.sort_values("rank"))
The code omits the missing observation and retains average ranks for the tie. If missing values are made neutral instead, the neutralization should be an explicit rule rather than a side effect of the ranking library.
What positive, zero, and negative ranks mean
A positive centred rank lies above the middle of the eligible cross-section in the recorded orientation. A negative rank lies below it. Zero marks the centre or the midpoint of a tied group that spans the centre.
These meanings are relative. A positive profitability rank says that a company has higher measured profitability than most eligible peers on that date. It does not say that profitability is high in an absolute historical sense, nor that the subsequent return will be positive.
Ranking within groups
Some factor definitions compare each security only with a sector, industry, country, or asset-class peer group. If \(G(i,t)\) is the group containing security \(i\), the calculation becomes
\[q^{\mathrm{group}}_{i,t} = 2\left( \frac{r_{i,t}^{G(i,t)}-1}{N_{G(i,t),t}-1} \right)-1.\]
Within-group ranking reduces broad group effects. It also gives small groups coarse and potentially unstable ranks. Minimum group size and a fallback for small groups need to be stated. Group ranking is related to neutralization, but the two procedures are not identical: a regression can remove several continuous and categorical exposures simultaneously.
Rank direction and factor meaning
The raw ordering does not supply an economic direction. Higher earnings yield may be assigned a positive value in a value factor, while higher leverage may be assigned a negative value in a quality factor. For input \(k\), record an orientation \(o_k\in\{-1,+1\}\) and calculate
\[z^{(k)}_{i,t}=o_k q(x^{(k)}_{i,t}).\]
Several oriented ranks can then be combined:
\[s_{i,t}=\sum_{k=1}^{K}\alpha_k z^{(k)}_{i,t}.\]
The crowding example in What Is Factor Crowding? uses this method for days to cover, short-sale volume ratio, and recent return.
Common implementation mistakes
Ranking across dates
Cross-sectional ranking compares securities at one observation time. Ranking a pooled security-date table allows long-run changes in scale to alter today's relative order.
Using the current universe in historical ranks
Historical ranks require the securities that were eligible on each date. Present-day membership introduces survivorship and selection bias.
Letting row order break ties
An ordinal or “first” tie method assigns different ranks according to storage order. That may be appropriate for a documented secondary key, but it should not decide economically identical observations accidentally.
Converting missing values to the bottom rank
Unavailable data does not imply the weakest possible characteristic. Keeping the value missing, applying a documented neutral value, or making the security ineligible are separate policy choices.
Ranking before validating extremes
Ranks reduce the numerical influence of an outlier, but a bad observation can still receive the most influential endpoint rank. Corporate actions, unit errors, stale data, and impossible values need validation first.
Comparing ranks from different universes
Two values of \(+0.8\) are comparable only when their universe and group conventions are compatible. Coverage metadata should travel with the score.
Use in factor evaluation and portfolios
Ranked signals are naturally evaluated with Spearman information coefficient, which compares the ordering of the signal with the ordering of later returns. Rank-based evaluation is less sensitive to a few extreme outcome magnitudes, although it still depends on universe, ties, missingness, and timing.
Portfolio construction can map ranks into quantiles, proportional holdings, or an optimization target. A top-minus-bottom quantile portfolio uses only broad rank regions. An optimizer can use the full centred vector while constraining sector, size, liquidity, and other exposures. The rank supplies the relative signal; it does not determine the final weight scale.
Frequently asked questions
Should the highest rank be 1 or N?
Either convention works if orientation is explicit. This article uses ascending ranks and then maps them to \([-1,+1]\), so the highest raw value becomes \(+1\).
What happens when every value is identical?
Every observation receives the same average rank. A centred implementation should return zero exposure or mark the cross-section as having no dispersion, rather than invent an ordering.
Are percentile ranks stable when the universe changes?
They are often more stable than raw values measured on a changing scale, but a large addition or removal can change every remaining percentile. Record universe membership and monitor rank turnover around reconstitutions.
Does ranking solve outlier problems?
It limits their distance-based influence. It does not establish that the observation is valid, and it still places an extreme value at an endpoint.
Next reading
- Should Alpha Factors Be Z-Scored or Ranked?
- How Should Missing Factor Values Be Handled?
- What Is a Trading Signal in Quantitative Finance?
Sources
- pandas
DataFrame.rankdocumentation - SciPy
rankdatadocumentation - Charles Spearman, “The Proof and Measurement of Association between Two Things”, The American Journal of Psychology, 1904.
This walkthrough is for research and educational purposes. It illustrates how strategynet.ai organizes signal evidence into factors and scenarios. It provides no recommendation, investment advice, or instruction to trade any security.
Back to Insights