
Should Alpha Factors Be Z-Scored or Ranked?
Z-scores and ranks put security measurements on comparable scales. Z-scoring expresses distance from the cross-sectional mean in standard-deviation units; ranking expresses ordered position. The choice determines how much influence the distances between raw observations retain in a factor.
This article applies both transformations to the same six values and examines their effects on signal interpretation and portfolio construction. The comparison helps researchers choose a transformation suited to the input's distribution, economic meaning, and intended use.
Mathematical definitions
For \(N_t\) valid observations \(x_{i,t}\) in universe \(U_t\), the cross-sectional z-score is
\[z_{i,t} = \frac{x_{i,t}-\bar{x}_t}{\sigma_t}, \qquad \bar{x}_t=\frac{1}{N_t}\sum_{j\in U_t}x_{j,t},\]
with
\[\sigma_t = \sqrt{\frac{1}{N_t}\sum_{j\in U_t}(x_{j,t}-\bar{x}_t)^2}\]
under the population-standard-deviation convention used here. Libraries may default to a sample denominator \(N_t-1\), so the convention should be recorded.
For ascending average rank \(r_{i,t}\), the centred rank used in this example is
\[q_{i,t} = 2\left(\frac{r_{i,t}-1}{N_t-1}\right)-1.\]
Both transformations preserve order when there are no ties. They preserve different distances.
Worked example
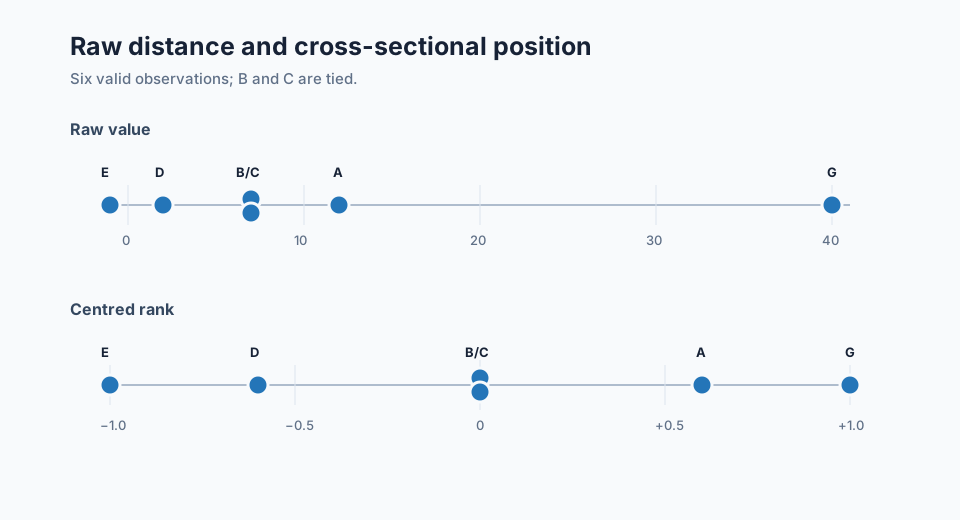
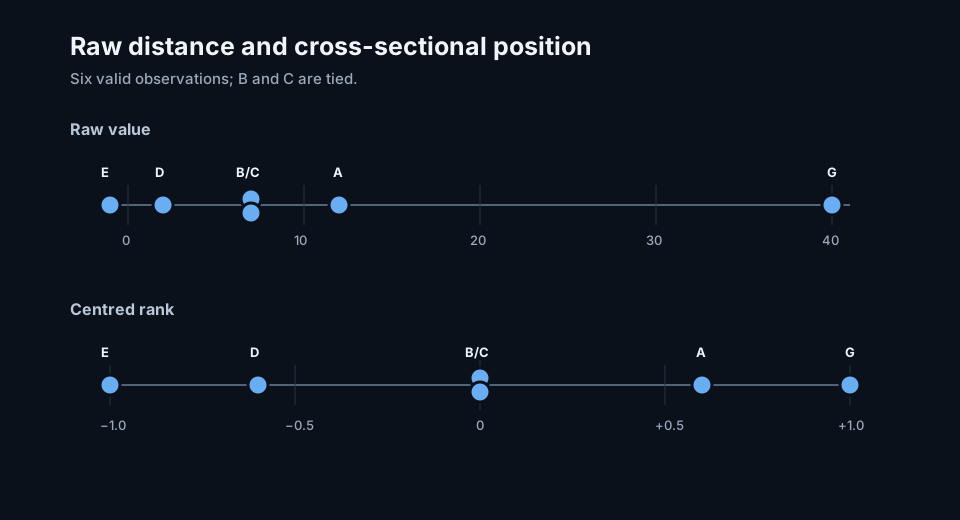
Use the six valid raw values from the cross-sectional ranking article: \(-1,2,7,7,12,40\). Their mean is \(11.167\) and their population standard deviation is \(13.533\).
Z-scores and centred ranks for the same cross-section
| Security | Raw value | Z-score | Centred rank |
|---|---|---|---|
| E | −1 | −0.899 | −1.0 |
| D | 2 | −0.677 | −0.6 |
| B | 7 | −0.308 | 0.0 |
| C | 7 | −0.308 | 0.0 |
| A | 12 | +0.062 | +0.6 |
| G | 40 | +2.131 | +1.0 |
G's value of 40 raises both the mean and the standard deviation. A's raw value of 12 is the second-highest observation, giving it a centred rank of \(+0.6\), yet it sits only \(0.062\) standard deviations above the shifted mean. The two transformations agree on ordering and disagree sharply on relative strength.
Python comparison
import pandas as pd

raw = pd.Series({"E": -1.0, "D": 2.0, "B": 7.0,
                 "C": 7.0, "A": 12.0, "G": 40.0})

z_score = (raw - raw.mean()) / raw.std(ddof=0)
rank = raw.rank(method="average")
centred_rank = 2 * (rank - 1) / (raw.count() - 1) - 1

comparison = pd.DataFrame(
    {"raw": raw, "z_score": z_score, "centred_rank": centred_rank}
)
print(comparison.round(3))
Information retained by each method
Z-scoring retains relative distance from the mean. If one security's measured earnings-revision breadth is genuinely several standard deviations stronger than the rest, that magnitude can receive greater influence in a composite or portfolio target.
Ranking retains order. The gap between first and second receives the same rank step regardless of whether their raw values are almost equal or far apart. This limits the influence of heavy tails, unit changes, and nonlinear monotonic relationships, while discarding potentially useful distance information.
Positive, zero, and negative values
A positive z-score lies above the cross-sectional mean; a negative z-score lies below it. Zero equals the mean. A positive centred rank lies above the median position under the chosen rank convention; a negative rank lies below it.
Mean and median can differ in skewed data. The example demonstrates the consequence: A is well above the median rank but only slightly above the mean after G pulls the mean upward. Neither result is erroneous. Each describes a different centre and scale.
When z-scores are useful
Z-scores are a reasonable choice when:
- the raw measurement has meaningful distances;
- units and accounting definitions are consistent across the universe;
- the distribution is sufficiently stable after validation and outlier treatment;
- the model is intended to react more strongly to genuinely extreme values;
- group-specific means and scales are estimated from enough observations.
They are also convenient for regression and covariance calculations, although standardization alone does not make a distribution normal.
When ranks are useful
Ranks are often preferable when:
- the raw distribution is skewed, heavy-tailed, or unstable across dates;
- only monotonic ordering has an economic interpretation;
- inputs use unlike units and will enter a composite;
- isolated extremes should not dominate portfolio exposure;
- the evaluation target is rank IC or a quantile spread.
Coarse data creates many ties, reducing the number of distinct ranks. A rank transformation cannot recover information that the source field does not contain.
Winsorized z-scores
Winsorization caps extreme observations before the mean and standard deviation are estimated. If one observation is capped at each end of the six-value example, the transformed raw values become \(2,2,7,7,12,12\). Their mean is 7 and their population standard deviation is \(4.082\), producing z-scores of \(-1.225,-1.225,0,0,+1.225,+1.225\).
This result lies between unrestricted magnitude and pure ordering. The cap is a material model parameter: it creates ties, changes the centre and dispersion, and should be selected before holdout evaluation. The full calculation is covered in How Do You Winsorize an Alpha Factor?.
Common implementation mistakes
Standardizing across the entire history
Cross-sectional z-scores use the mean and dispersion at one date. A full-history mean introduces future distribution information and mixes time-series with cross-sectional scale.
Leaving the standard-deviation convention implicit
Population and sample denominators differ, especially in small groups. Record
ddof, weighting, and the behaviour when dispersion is zero.
Z-scoring before validating units
A currency conversion error or unadjusted split may be made less visible by standardization while still distorting every other observation's mean and scale.
Ranking missing values as weak observations
Missingness is a data state. Assigning it the bottom rank creates a forecast direction that was never observed.
Comparing methods with different coverage
Z-score and rank tests should use the same valid security-date pairs. Otherwise the result combines a transformation difference with a universe difference.
Selecting the transform from one attractive backtest
Compare both conventions across dates, regimes, sectors, turnover, and perturbations. A transform chosen after repeatedly inspecting the holdout no longer has a clean holdout result.
Consequences for signal and portfolio evaluation
Ranked inputs often pair naturally with Spearman IC and quantile portfolios. Z-scored inputs can be evaluated with both Spearman and Pearson IC: a large gap between them may reveal nonlinear relationships or a few influential observations.
In portfolio construction, proportional use of z-scores can create large positions in extreme names. Ranks impose a bounded input, but a covariance optimizer can still concentrate holdings when risks and constraints permit it. Inspect exposure concentration, turnover, capacity, and performance after costs under both transformations.
Frequently asked questions
Can the same factor use both methods?
Yes. Different inputs in a composite can use different declared transformations, or two factor versions can be evaluated side by side. The version record must make the difference visible.
Does a z-score of 2 mean a value is rare?
It means the observation lies two estimated cross-sectional standard deviations above the mean. A probability interpretation requires distributional assumptions that may be poor for financial characteristics.
Does ranking always reduce turnover?
No. Small raw changes near a rank boundary can swap positions frequently, especially in a dense middle cross-section. Buffer rules or smoothed source features may matter more than the bounded scale.
Which method should a composite signal use?
Use the method consistent with the economic meaning of each input, then compare out-of-sample stability, incremental information, turnover, and portfolio behaviour. Ease of calculation is not sufficient evidence.
Next reading
- What Is Cross-Sectional Ranking?
- How Do You Winsorize an Alpha Factor?
- How Should Missing Factor Values Be Handled?
Sources
This walkthrough is for research and educational purposes. It illustrates how strategynet.ai organizes signal evidence into factors and scenarios. It provides no recommendation, investment advice, or instruction to trade any security.
Back to Insights